Core Web Vitals Explained: LCP, INP and CLS (2026)
Core Web Vitals are three Google metrics for loading, responsiveness and visual stability. Here's what LCP, INP and CLS mean, their thresholds, and how to fix each.
Here is something that still catches people off guard: your page can score well in a local Lighthouse run and still be failing Google's Core Web Vitals in the real world.
The difference is that Core Web Vitals are measured on actual Chrome users, not a lab simulation. Google collects timing data across real devices and real networks, then ranks you on the slowest 25% of those visits. Not your average visitor. The slow tail.
That's worth understanding before looking at the numbers, because it changes how you debug. A page that feels fast on your laptop is often a very different story on a mid-range Android phone on a patchy 4G connection.
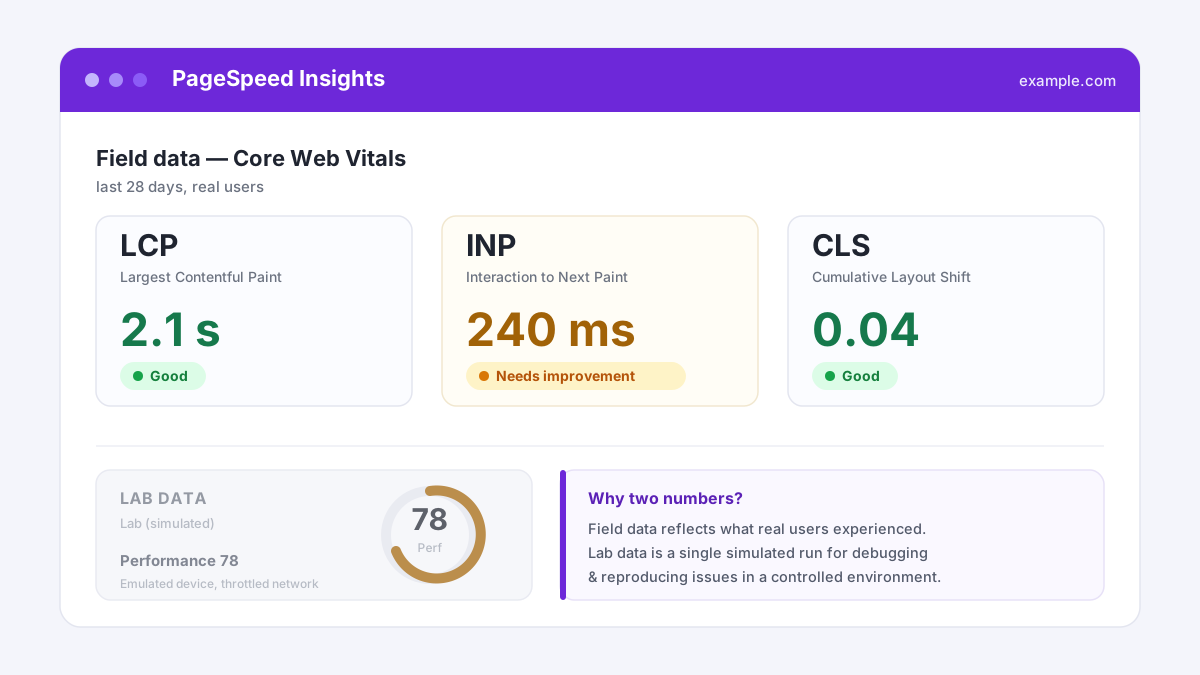
The three metrics at a glance
Each metric covers a different part of how a page feels. A page can pass one and fail another, so treat them as three separate problems.
| Metric | What it measures | Good | Needs work | Poor |
|---|---|---|---|---|
| LCP | Time until the largest visible element loads | under 2.5s | 2.5s to 4.0s | over 4.0s |
| INP | Delay between an interaction and the next paint | under 200ms | 200ms to 500ms | over 500ms |
| CLS | How much the layout shifts while loading | under 0.1 | 0.1 to 0.25 | over 0.25 |
Google judges your page at the 75th percentile. Three out of four visitors get a good score and you pass. Fail it for one in four and you don't, regardless of how good the rest look.
INP replaced FID in March 2024, and sites are still adjusting
If you've read an older performance guide, you'll see First Input Delay listed as the responsiveness metric. That changed.
FID measured only the gap between a user's first interaction and when the browser started processing it. Everything after that — the code running, the DOM updating, the repaint — was invisible to the metric. A lot of sites passed FID while still feeling sluggish.
INP closes that gap. It measures the full round trip for every interaction on the page: from input to the next visible paint. Every tap, every keystroke, every dropdown — all measured, and INP reports the worst case from the session.
The result: plenty of sites that comfortably passed FID now fail INP. JavaScript-heavy UIs that looked fine on the old metric are visibly in trouble on the new one.
Do Core Web Vitals actually affect rankings?
Honestly, they do — but as a tiebreaker rather than a primary signal. Google has been consistent on this: relevance wins. A slow page with the right answer will outrank a fast page with a weak one.
Where Vitals decide things is between closely matched pages. Which is, to be fair, most competitive queries.
There's also a second reason to care that has nothing to do with Google. Slow and unstable pages lose people. A visitor who taps a button and sees nothing for 600ms assumes the site is broken and leaves. Layout that shifts as ads load makes readers tap the wrong thing. Fixing Vitals improves conversions and reduces bounce rate whether or not there's a ranking reward for it.
How to fix LCP
LCP is almost always one specific element: a hero image, an <h1>, or a large background image. Before doing anything else, open Chrome DevTools or PageSpeed Insights and find out exactly which element it is. Don't guess.
Once you know the target:
- Serve it in WebP or AVIF. Modern formats cut file size by 25 to 50% with no visible quality difference. An oversized JPEG hero is the most common single cause of slow LCP.
- Preload it. A
<link rel="preload" as="image">in the<head>tells the browser to fetch the LCP element early, instead of discovering it after parsing the stylesheets. - Fix Time to First Byte first if it's slow. LCP can't complete before the server responds. A slow TTFB puts a ceiling on how fast LCP can ever be, regardless of what else you optimise.
- Remove render-blocking resources. Every blocking stylesheet and synchronous script in
<head>delays the first paint. Inline critical CSS and defer the rest.
How to fix INP
INP problems are almost always JavaScript problems. When the main thread is busy running scripts, it can't respond to a user tap.
- Break up long tasks. Any task running for over 50ms blocks input. Split heavy work into smaller chunks and yield back to the browser using
setTimeout(fn, 0)or the newerscheduler.yield(). - Defer non-essential scripts. Analytics, chat widgets, and ad tags rarely need to run before the user's first interaction. Load them after.
- Audit your third-party tags. This is the lever teams resist most, because you don't control third-party code. But tag managers and embeds are frequent INP culprits. A single heavy script in the
<head>can tank the entire page's responsiveness.
How to fix CLS
CLS is the jumping layout problem. You go to click a link, an ad loads above it, and the link slides away. Fixing it is mostly about reserving space for things before they arrive.
- Set explicit width and height on images and videos. Without dimensions, the browser doesn't reserve space. The reflow when the image loads is where most CLS originates.
- Reserve space for ads and embeds. Give iframe containers a fixed height so they don't push content down when they load.
- Don't insert content above existing content after load. Banners, cookie notices, and announcement bars that appear after the initial render all cause layout shifts.
- Preload fonts or use `font-display: optional` to prevent the reflow when a web font swaps in for the fallback.
Lab data vs field data: use both
Lab data (a Lighthouse run, PageSpeed Insights in lab mode) is a controlled simulation. Useful for debugging because you can isolate changes.
Field data (the Chrome User Experience Report, CrUX) reflects what real visitors experienced. That is what Google actually uses for ranking.
The right workflow: debug with lab data, then verify the improvement shows up in field data. Lab wins don't always translate, because your test environment doesn't match your real visitors' devices, networks, and interaction patterns. If you're only watching lab scores, you may be optimising against the wrong number.
A quick way to see all three Vitals at once is the UX and Core Web Vitals checker, which pulls real CrUX field data where available and falls back to a lab run.
Core Web Vitals are really just measurements of whether your site is pleasant to use. Fix a slow LCP and you're helping the user who waited for your page to load. Fix a high CLS and you're stopping the user who accidentally tapped the wrong button. The ranking benefit is almost secondary.
Want to see your Vitals alongside your full technical SEO picture? A free SEO audit checks all three plus crawlability, on-page, and AI-readiness in about a minute, no signup required.
Kaustav Basak is the creator of SEO AI Audits, a free AI-powered SEO toolkit. He writes about technical SEO, Core Web Vitals, and how search is changing in the age of AI assistants.
Put this into practice — free
Run a complete, AI-powered SEO audit of your site in about a minute. No signup.